* Landing pages should between 500-1000 words, with a minimum of one infographic/chart and at least one image.
* Topic pages should be 1000-2000 words in length, with a minimum of two infographics/charts (with the exception of policy and regulation pages) and at least one image.
* Both topic and landing pages should contain subheadings in “Heading 3” for consistency. These will appear in the “On this page” widget in the right sidebar as an content index for the page. Further instruction on how to add these styles can be found on the Adding Content to Topic Pages guide.
* References should be added using the “References” button available in the topic page editor. References using different styling should be updated to this method. Detail is available at Adding Content to Topic Pages guide.
* Topic and landing pages should start with an introductory paragraph and then an illustrative chart, infographic or image if possible.
* All topic and landing pages should have “Related resources” associated with the page. These are relevant library items or datasets stored in CKAN that will appear in the right sidebar and encourage the user to research further and explore the ODI data hub. These can be added by searching in the “Add related CKAN content” sidebar in the editor for topic pages.
* Infographics and charts should have a title on the page in Heading 5. This ensures consistency of presentation. If updating pages created earlier, titles may need to be removed from charts/infographics in the tool they were created with, in order to avoid a duplicated title.
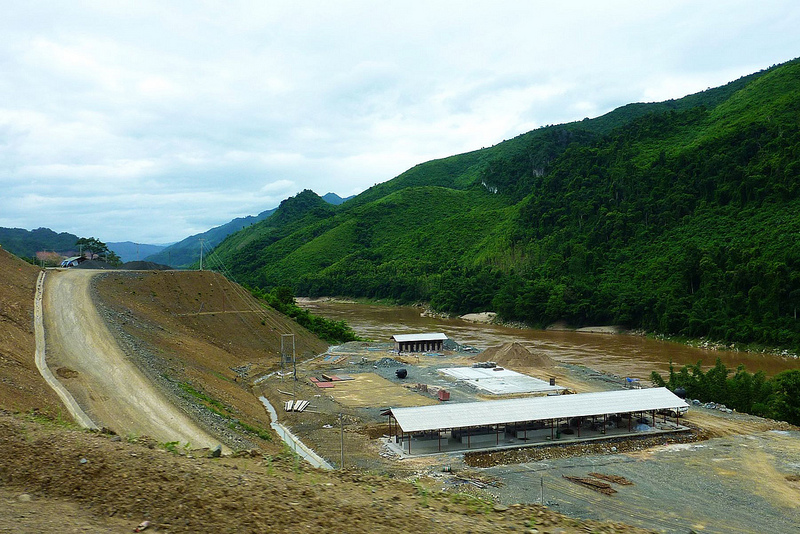
Text in the caption section would look:
<p>Tonle Sab Lake, Cambodia. <a href=“https://www.flickr.com/photos/asiandevelopmentbank/11431228924” target=“_blank”>Photo</a> by Asian Development Bank, take on 13 November 2009. Licensed under <a href=“https://creativecommons.org/licenses/by-nc-nd/2.0/” target=“_blank”>Attribution-NonCommercial-NoDerivs 2.0</a></p>
Many people look at visualizations without carefully reading all the text first, therefore we should design visualizations that are self-explanatory. Specifically, these elements should be part of the viusualization itself and not just in accompanying text. Below is a checklist of the components that these need to be of greatest use to site visitors.